
Rent vs. Buy Calculator for Utah County
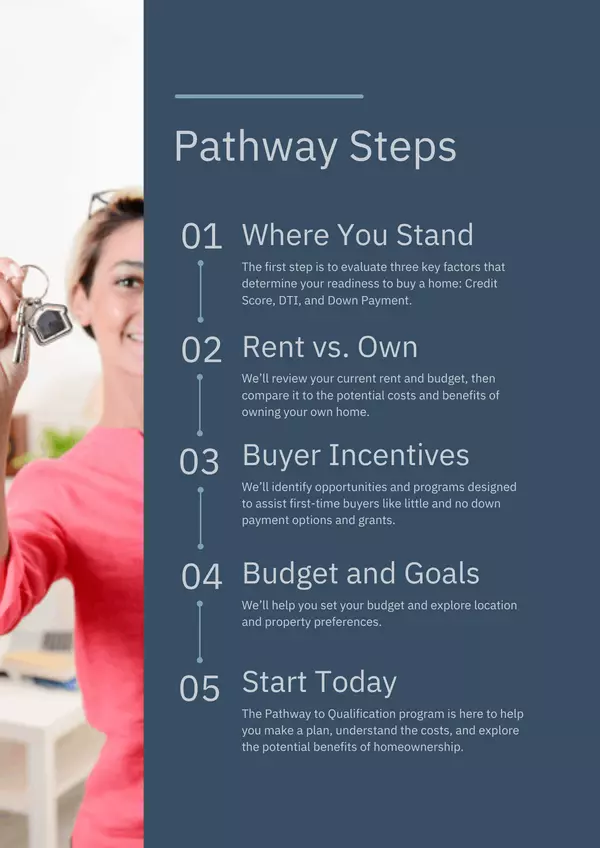
Many renters want to become homeowners, but the path to achieving that goal isn’t always clear. Our Pathway to Qualification program is designed to guide first-time buyers, helping you understand where you stand and what steps you can take to prepare for homeownership.
Rent vs. Buy Calculator
Rent is money spent. A mortgage payment is partly money spent and partly money saved. This compares the two side by side — cash flow, appreciation, principal paid down, and tax benefits, year by year.
Loan
Costs of owning
Costs of renting
Growth assumptions
Taxes
Where the money comes from
Both paths commit the same total cash. The difference is what you have to show for it.
Buying builds
Renting builds
Net worth over time
| Year | Net worth: buy | Net worth: rent | Difference |
|---|
Monthly cost
If you buy
If you rent
Rent is an expense and this calculator treats it as one. Not one dollar of rent comes back. A renter's balance comes from two other places entirely: the down payment and closing costs they never spent, and any month when renting costs less than owning. An owner's interest, property tax, insurance and maintenance are expenses in exactly the same way — only the principal portion of a mortgage payment builds anything.
The comparison is apples to apples. Both paths start with the same cash and commit the same total dollars every month. Whichever costs less in a given month, that side keeps the difference. Tax savings are kept, not spent. Buying pulls ahead the month your home equity, after the cost to sell, passes what the renter is holding.
Homeowners build wealth three ways that renting doesn't offer: the home appreciates, every mortgage payment converts cash into equity, and mortgage interest plus property tax may be deductible above the standard deduction. Renters build wealth one way — keeping the money they didn't put into a house. This calculator counts all four.
The one assumption that decides everything
Under Sits in the bank, neither side invests. Money not spent on the house is held as cash. This is the straight comparison of using the dollars you'd spend on rent to buy instead — and buying typically wins in three to seven years, because appreciation and principal paydown compound while rent only goes up.
Under Gets invested, that same cash earns a market return, which charges buying the full opportunity cost of the down payment. This is the assumption most national rent-vs-buy calculators make silently, and it is why they report much longer breakeven horizons. It requires the renter to actually invest every spare dollar for decades and never touch it — something a mortgage does automatically but few renters manage. Neither setting is wrong; they answer different questions, so the calculator lets you see both.
Either way, buying does not win in every scenario. Set appreciation to zero or negative and it takes fifteen years or more to recover the cost to sell. Short holding periods lose money in almost any market. The breakeven number is the honest answer to "how long do I need to stay."
Default assumptions
- 4.0% home appreciation. Case-Shiller National (4.31%/yr since 1987) and FHFA Purchase-Only (4.30%/yr since 1991) both land near 4.3%; 4.0% shades below that.
- 0% return on uninvested cash by default. Switching to "Gets invested" uses 6.5%: the S&P 500 has returned about 10.5%/yr since 1926, but Vanguard's current 10-year forecast for US equities is 4.2–6.2%, so 6.5% stays below the historical average.
- 3.5% rent growth. CPI rent of primary residence has run 3.4–3.5%/yr in every window since 1995. Near-term growth is softer, around 2%.
- 1.0% maintenance. Harvard's Joint Center for Housing Studies puts owner spending at about $1,200/yr on repairs and $5,900/yr including replacements and improvements. 1% funds the replacements a 30-year model has to cover.
- 2.5% closing costs, 8% total cost to sell. Title, settlement and transfer taxes average about 1% of price, plus lender fees and prepaids. Selling includes roughly 5% in commissions plus title, transfer taxes and prep.
- 30-year horizon, 10-year default. Median seller tenure is about 11 years, an all-time high driven by rate lock-in.
Every one of these is editable above. The two biggest levers are the home appreciation rate and whether uninvested cash earns a return. Change either and the breakeven moves by years.
This calculator is an estimate for educational purposes only and is not financial, tax, investment, or lending advice. Projections are hypothetical, are not a guarantee of future results, and assume steady rates of return that no real market delivers. Actual results vary with market conditions, loan terms, and your tax situation. Consult a qualified professional before making a decision.
WE'LL HELP YOU MAKE A PLAN TO BUY YOUR FIRST PLACE
Our Pathway to Qualification program is designed to help first-time homebuyers plan and prepare to purchase their first property whether timed at the end of their lease or when the timing is right. No rush. No obligation. The sooner you start, the sooner you live your dream.

Download the Pathway to Qualification Guide
I'LL HELP YOU GET READY TO BUY YOUR FIRST HOME

Agent, Author, Coach License ID: 9587700-SA00